This article is useful for readers who have little idea on how Teclo’s work and would like to get to know them better. The goals of this article is to breakdown Starhub’s different business lines and explain each of them in detail. There is a comp table at the bottom.
Starhub’s business is split into its consumer and enterprise units
Consumer Division – 51% of 2019 Revenue
1) Mobile – 32.8% of 2019 Revenue
Range of mobile services, allowing customers to call, text and access the internet. Starhub has created [Giga!] which is their SIM-only digital brand launched in Q2 2019.
2) Pay TV – 10.6% of 2019 Revenue
Access to International and local TV channels to catch the latest dramas, education or sports programmes. Starhub also has an OTT app called Starhub Go. OTT stands for over-the-top which is offers a streaming media service directly to viewers over the internet by bypassing companies that traditionally act as a distributor of such content (like cable networks). Starhub also has a Starhub Go Streaming Box.
3) Broadband – 7.6% of 2019 Revenue.
Broadband stands for the transmission of wide bandwidth data over a high speed internet connection.
Enterprise Division – 49% of Revenue
Divided into Network solutions (consisting of Connectivity and Managed Services) as well as Cyber security services.
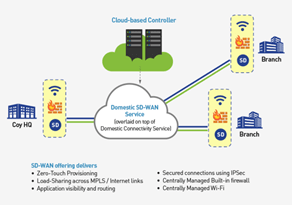
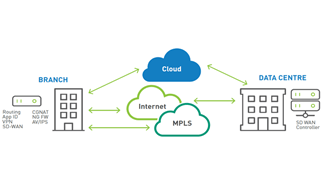
1) Connectivity.
– Local and International Connectivity through their Wide Area Network services.
– Allows Cloud Connect, providing access to other Cloud Service Providers such as AWS and Microsoft Azure.
– Data Center Services to store, processes and disseminate data.
– Provides their own Cloud platform for storage or hosting.
– Mobile plans on an enterprise scale.
– Provides Office lines, smart conferencing and unified communications (cloud based phone system).
– Enterprise messaging.
– Enterprise Mobility Management. Manages how mobile devise are used within an organization for routine business operations and ensuring integration, safety and ease of use.
– Emerging technology such as Artificial intelligence and data analytics solutions are provided.
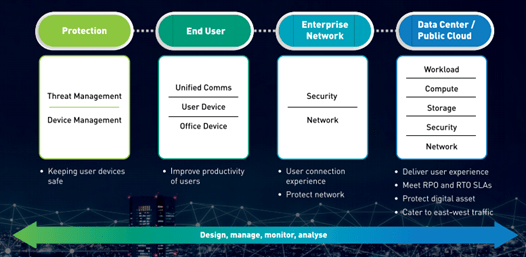
2) Managed Services.
Provides end to end services for networking, collaboration, hybrid cloud and security.
3) Cyber security Services
Starhub owns 60% of Ensign infosecurity which protects customers’ digital infrastructure from cyber threats. Provides network based Distributed Denial-of-Service mitigation service as well as mobile and cloud security services.

Recent Financial Results
Consumer – Mobile – 31.6% of total revenue
– Segment Revenue fell to 12.5% q-o-q and 25.6% y-o-y.
– Lower postpaid ARPU due to lower roaming, value added services and data usage revenues. Drop from $30 to $30 y-o-y.
– Number of subscribers fell minimally to 1,453,000.
– Prepaid ARPU fell to $10 from $14 y-o-y.
– 634,000 prepaid subscribers from 789,000 y-o-y.
Consumer – Pay TV – 10.34% of total revenue
– No change in revenues q-o-q but 27.5% drop y-o-y
– Lower ARPU due to promotional activities relating to cable-to-fibre migration.
– 13% drop in subscriber’s y-o-y. Now standing at 324,000.
Consumer – Broadband – 9.53% of total revenue
– The most resilient of the consumer division.
– Revenues experienced minimal change at $43.2 million.
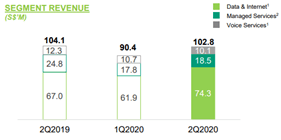
Enterprise – Network Solutions – 22.67% of total revenue
– Revenues remain robust.
– Do note that there was a one-off revenue from delivery of data transmission equipment.
– Managed solutions getting impacted as companies hold back on CAPEX.
– Lower domestic and international travel has affected the voice solutions.
Enterprise – Cyber security Services – 8.78% of total revenue
– Hovering at $39.8 million. Stagnant growth. 1% y-o-y.
Non service revenue – 17.03% of total revenue
Promising news on Operating Expenses
2Q2020 Opex declined 19.8% YoY and 5.8% QoQ.
This is due to absence of one off cable migration costs. This will likely be sustained.
Lower staff costs (11% of total costs) due to lower headcount, reversal of staff compensation and reversal of structuring costs. This can also be sustained.
Lower operating leases due to rental rebates from COVID-19 stimulus packages and one-off refund form landlord. Lower leases is unlikely to be sustained. However this is only 1.3% of total costs, so the effects should not be significant.
Progressive reduction on capex spent on legacy networks over last few years, have been driving Cash Flows.
How will revenues, costs and margins look like moving forward?
1H of Starhub’s 2020 revenues were down 16.5% yoy. This is in line with Singtel’s revenue falling 12.0% yoy. Starhub has provided guidance on 10-12% Y-o-Y fall in revenue.
Starhub’s service EBITDA margin was 31.3% at the first half of 2020. This is consistent with 2016-2019’s Service EBITDA margin. 31.2%, 27.9%, 28.4%, 31.7%. Starhub has provided guidance for EBITDA to be between 27-29%.
http://ir.starhub.com/investors/?page=Announcements
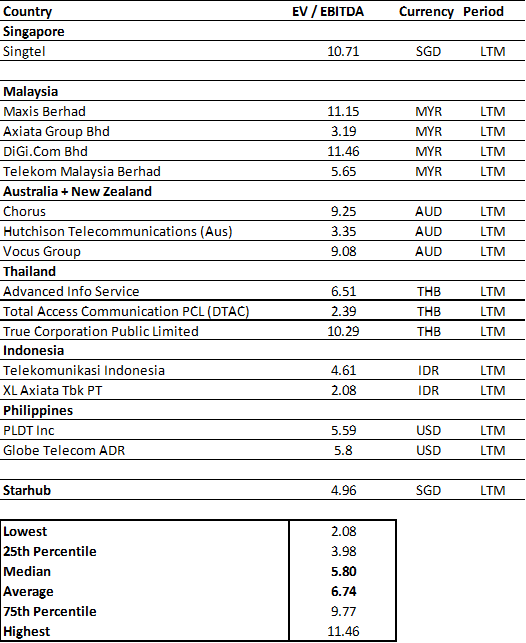
Comparison Table for Starhub:
The goal is just to provide a snapshot of how the comps are being priced.